
The monumental effort, led by Dr. Helen Ockenden from the University of Grenoble-Alpes and co-authored by Professor Robert Bingham, a glaciologist at the University of Edinburgh, leveraged sophisticated satellite data and the fundamental physics governing glacier movement. By meticulously analyzing how the ice sheet’s surface topography and velocity are influenced by the bedrock beneath, researchers were able to infer the contours of the continent’s hidden geology. This innovative approach has brought into focus thousands of previously undiscovered hills and ridges, and has significantly sharpened the images of known subglacial mountain ranges and valleys, providing a resolution previously unattainable.
Historically, exploring Antarctica’s subglacial landscape has been an arduous and technically challenging endeavor. Traditional methods have relied primarily on airborne or ground-based radar surveys. These techniques involve sending radar pulses through the ice, which then bounce back from the bedrock, revealing its depth and characteristics. While effective, these surveys are often conducted along individual flight lines or tracks, which can be tens, or even hundreds, of kilometers apart. This leaves vast, unmapped expanses, forcing scientists to extrapolate or "fill in the gaps" with educated guesses, resulting in a coarse and often incomplete picture.
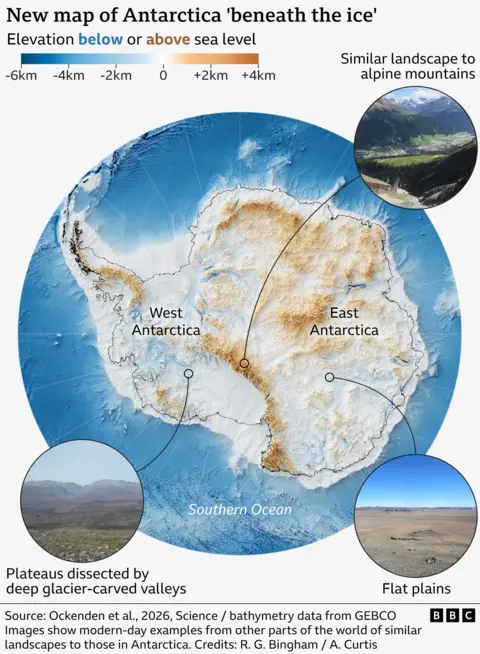
Professor Bingham likens the previous state of knowledge to trying to map the intricate relief of the Scottish Highlands or the European Alps if they were entirely buried under ice, and the only information available came from occasional flights several kilometers apart. "There’s no way that you would see all these sharp mountains and valleys that we know to be there," he explains, highlighting the inherent limitations of sparse data. The new methodology bypasses these limitations by adopting a holistic view.
The breakthrough lies in understanding the complex interplay between the flowing ice and the solid earth beneath. "It’s a little bit like if you’re kayaking in a river, and there’s rocks underneath the water, sometimes there’s eddies in the surface, which can tell you about the rocks under the water," Dr. Ockenden elaborated. While ice flows far more slowly and viscously than water, the principle remains. As the massive ice sheet grinds and slides over the bedrock, its flow patterns and surface topography are subtly, yet detectably, altered by the underlying landscape. A subglacial ridge, for instance, might cause the ice flowing over it to thin slightly or to accelerate or decelerate in specific ways, creating discernible patterns on the ice surface or in its velocity field that can be captured by satellites.
By combining precise satellite measurements of the ice surface elevation and velocity with glaciological models that describe how ice deforms and flows, the researchers could effectively "reverse engineer" the bedrock topography. These inferences were then rigorously checked against existing radar survey lines, validating the accuracy and enhanced detail of the new map. The result is a panoramic, high-resolution view that transforms our understanding of Antarctica’s true geography. "I’m just so excited to look at that and just see the whole bed of Antarctica at once," said Professor Bingham, marveling at the scope of the achievement.
Among the myriad new features revealed, one particularly intriguing discovery is a deep, extensive channel carved into the bedrock within the Maud Subglacial Basin in East Antarctica. This colossal channel averages 50 meters deep and 6 kilometers wide, stretching for nearly 400 kilometers – a distance comparable to traveling from London to Newcastle. Such a feature suggests powerful erosional forces, likely ancient rivers or earlier, more dynamic ice streams, that once shaped this now-hidden landscape. The improved resolution also brings features like the Golicyna Subglacial Highlands into sharper focus, delineating their peaks and valleys with far greater clarity than previous maps. "It’s like before you had a grainy pixel film camera, and now you’ve got a properly zoomed-in digital image of what’s really going on," Dr. Ockenden noted, emphasizing the qualitative leap in data.
The scientific implications of this highly detailed map are profound, particularly for climate science. The topography of the bedrock beneath an ice sheet is a primary control on its stability and flow dynamics. Subglacial mountains and ridges can act as "pinning points," slowing the flow of ice and stabilizing ice sheets. Conversely, deep, broad valleys can channel fast-flowing ice streams, accelerating their movement towards the ocean. The presence of retrograde slopes – bedrock that deepens inland – is a critical factor in the marine ice sheet instability hypothesis, suggesting that once an ice sheet begins to retreat over such a slope, the process can become self-sustaining and irreversible, leading to rapid ice loss.
With this unprecedented detail, glaciologists can now develop far more accurate and sophisticated computer models of Antarctic ice sheet behavior. These models are essential tools for predicting how quickly different parts of the ice sheet might melt or collapse under various climate change scenarios. Understanding the precise contours of the bed will allow scientists to better simulate where warm ocean waters might penetrate beneath floating ice shelves, how efficiently ice streams will drain the interior, and where potential "tipping points" for rapid retreat might exist. This enhanced predictive capability is vital, as the future rate of Antarctic melting is widely considered one of the biggest unknowns in projections of global sea-level rise, directly impacting coastal communities worldwide.
While the new map represents a monumental leap forward, the researchers acknowledge that it is not the final word. The methodology relies on certain assumptions about ice flow physics, and like any model, it comes with inherent uncertainties. Further complementary data, collected through ongoing ground-based radar surveys, airborne missions, and future satellite observations, will continue to refine these maps. Much also remains to be discovered about the specific composition of the rocks and sediments beneath the ice, as well as the dynamics of subglacial lakes and hydrological systems.
Nevertheless, the scientific community broadly welcomes this advancement. Dr. Peter Fretwell, a senior scientist at the British Antarctic Survey in Cambridge, who was not involved in this study but has extensively contributed to previous mapping efforts, affirmed its value. "This is a really useful product," he stated, highlighting its ability to "fill in the gaps between those surveys" and provide a more comprehensive picture. He added that the study ultimately "gives us a better picture of what’s going to happen in the future and how quickly ice in Antarctica will contribute to global sea-level rise."
Published in the esteemed academic journal Science, this research marks a pivotal moment in polar science. It underscores the power of combining remote sensing technologies with fundamental physical principles to unveil hidden worlds. Beyond its immediate scientific applications, the new map offers a sense of profound geographical discovery, akin to exploring a newly found continent. "It’s like when you see a map of topography on Mars for the first time, and you’re like, ‘whoa, this is so interesting, this looks a bit like Scotland,’ or ‘this looks like nothing I’ve ever seen before’," remarked Dr. Ockenden, capturing the awe and excitement of peering into Antarctica’s deepest, most closely guarded secrets. This comprehensive understanding of Antarctica’s subglacial landscape is not merely an academic achievement; it is a critical step in preparing humanity for the environmental transformations ahead.